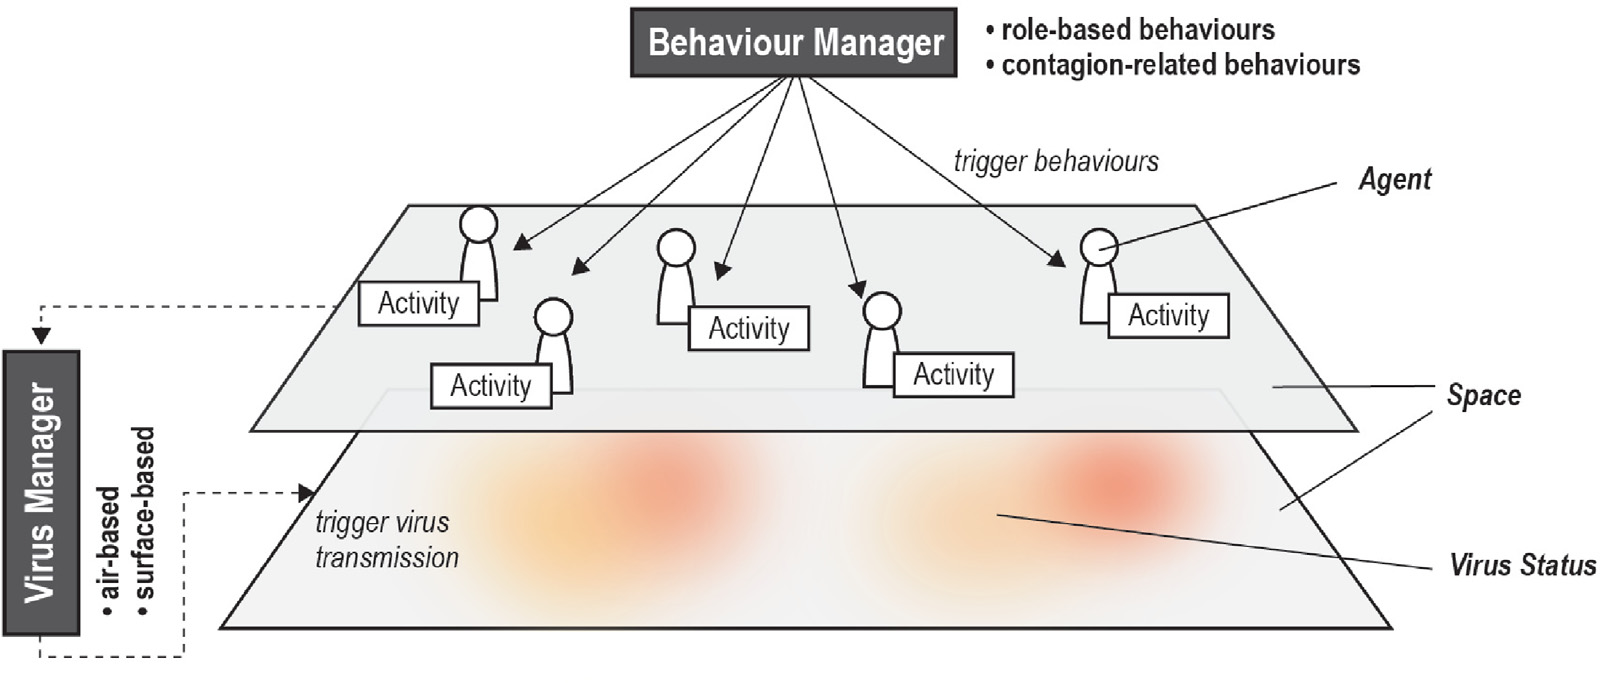
The multi-agent-based virus transmission simulation model architecture (Lee et al., 2021). A schedule manager triggered both planned and unplanned activities for agents in the building. When triggered, a virus manager triggers virus transmission in the space based on the associated agents’ locations and activity type (e.g., cough, sneeze, touch).
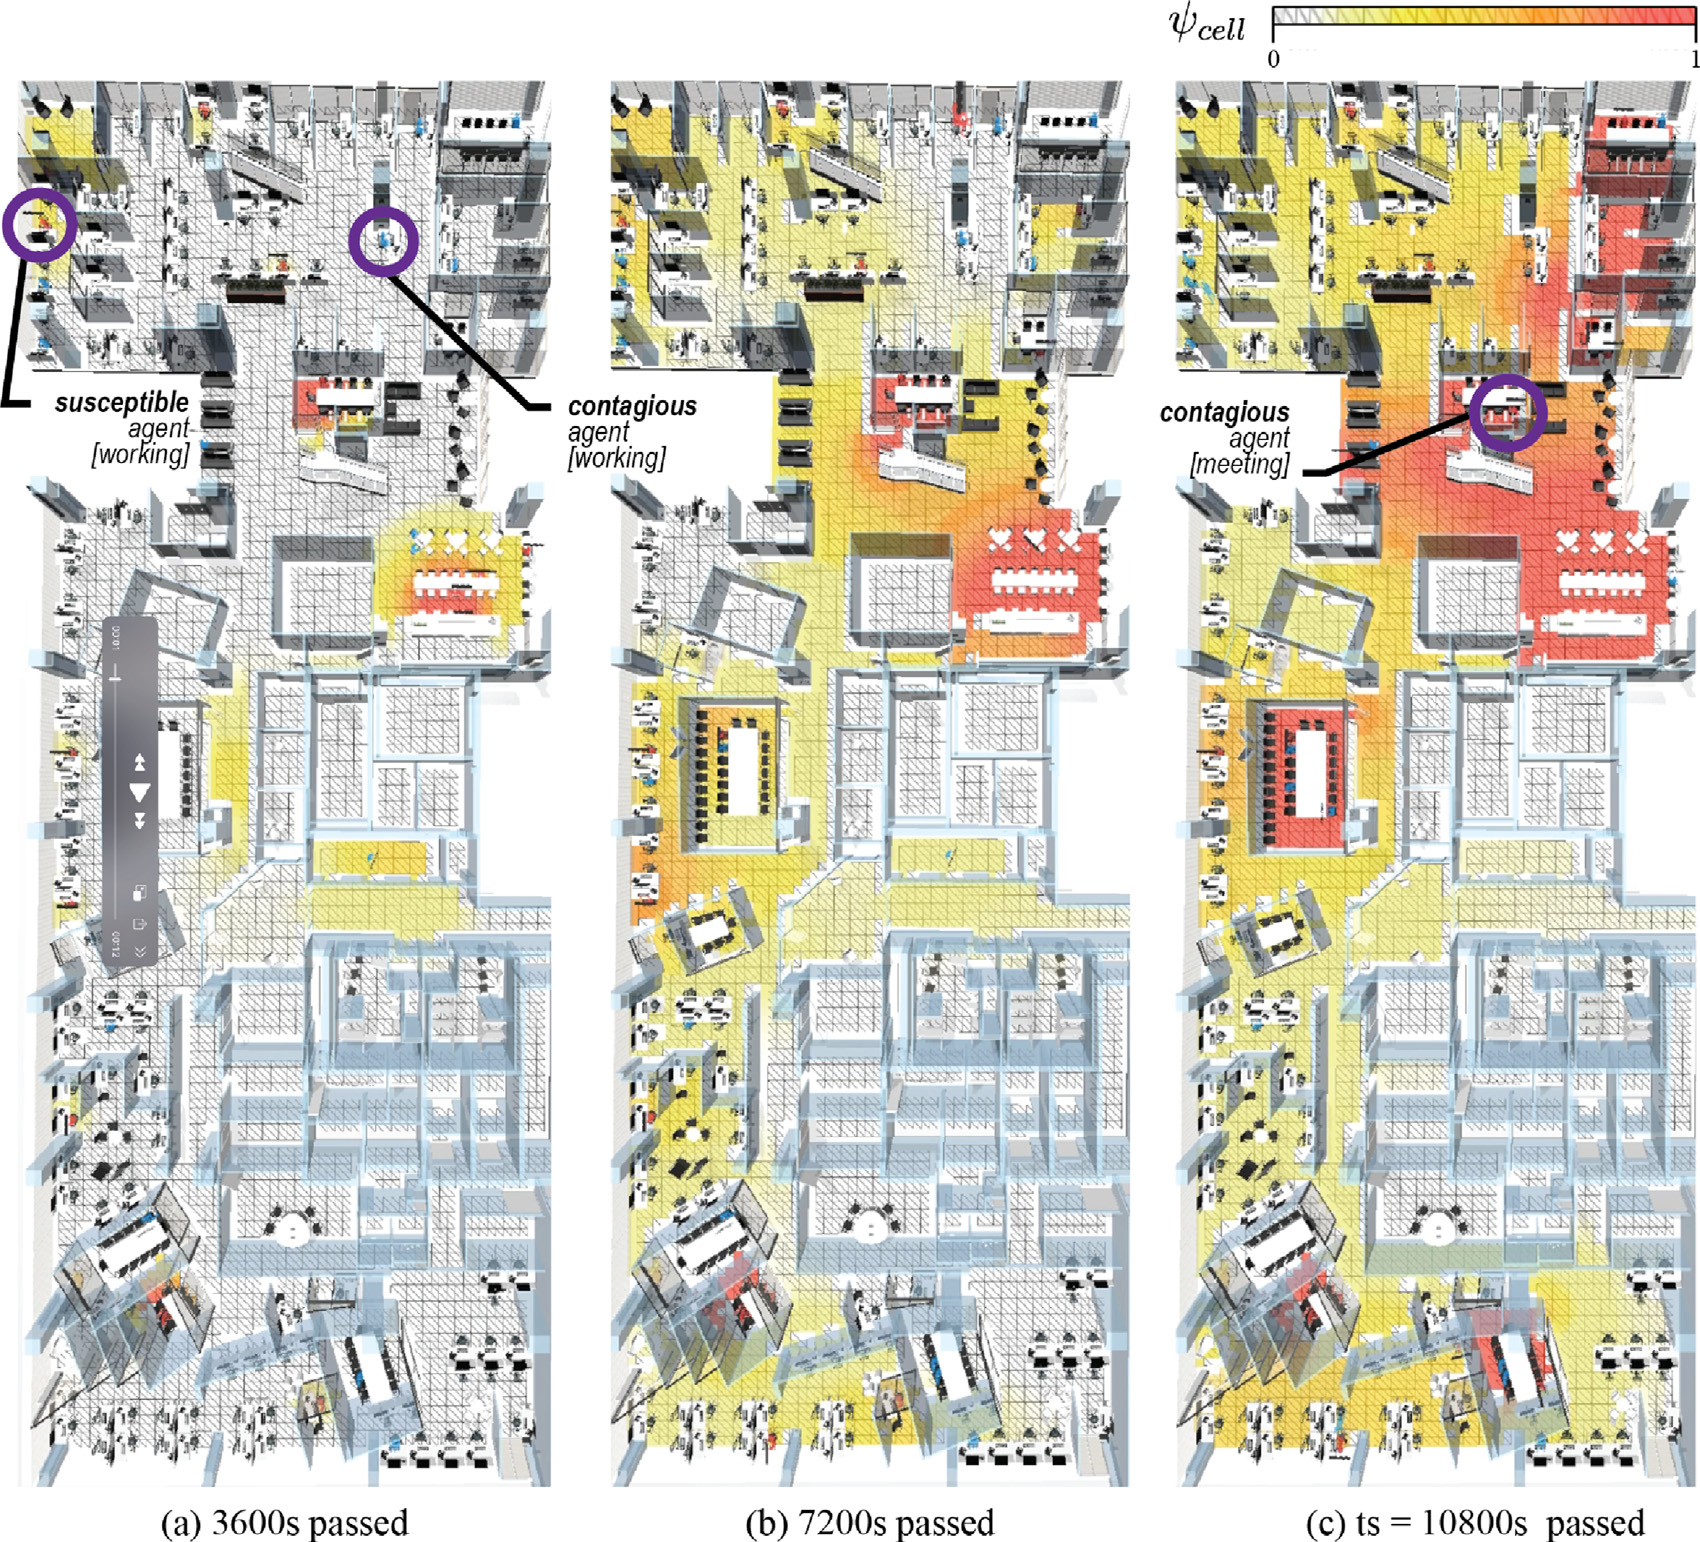
Screen-captured images of our simulation when the graphical mode was activated. The images were captured at specific moments: when (a) 3600 s, (b) 7200 s, and (c) 10 800 s had passed since the simulation started. The grid heat map on the background visualizes the location-specific concentration of virus in the air (𝜓𝑐𝑒𝑙𝑙 ), with the range from 0 to 1. The susceptible agents are represented as blue, while the contagious agents are represented as red. (For interpretation of the references to colour in this figure legend, the reader is referred to the web version of this article.)
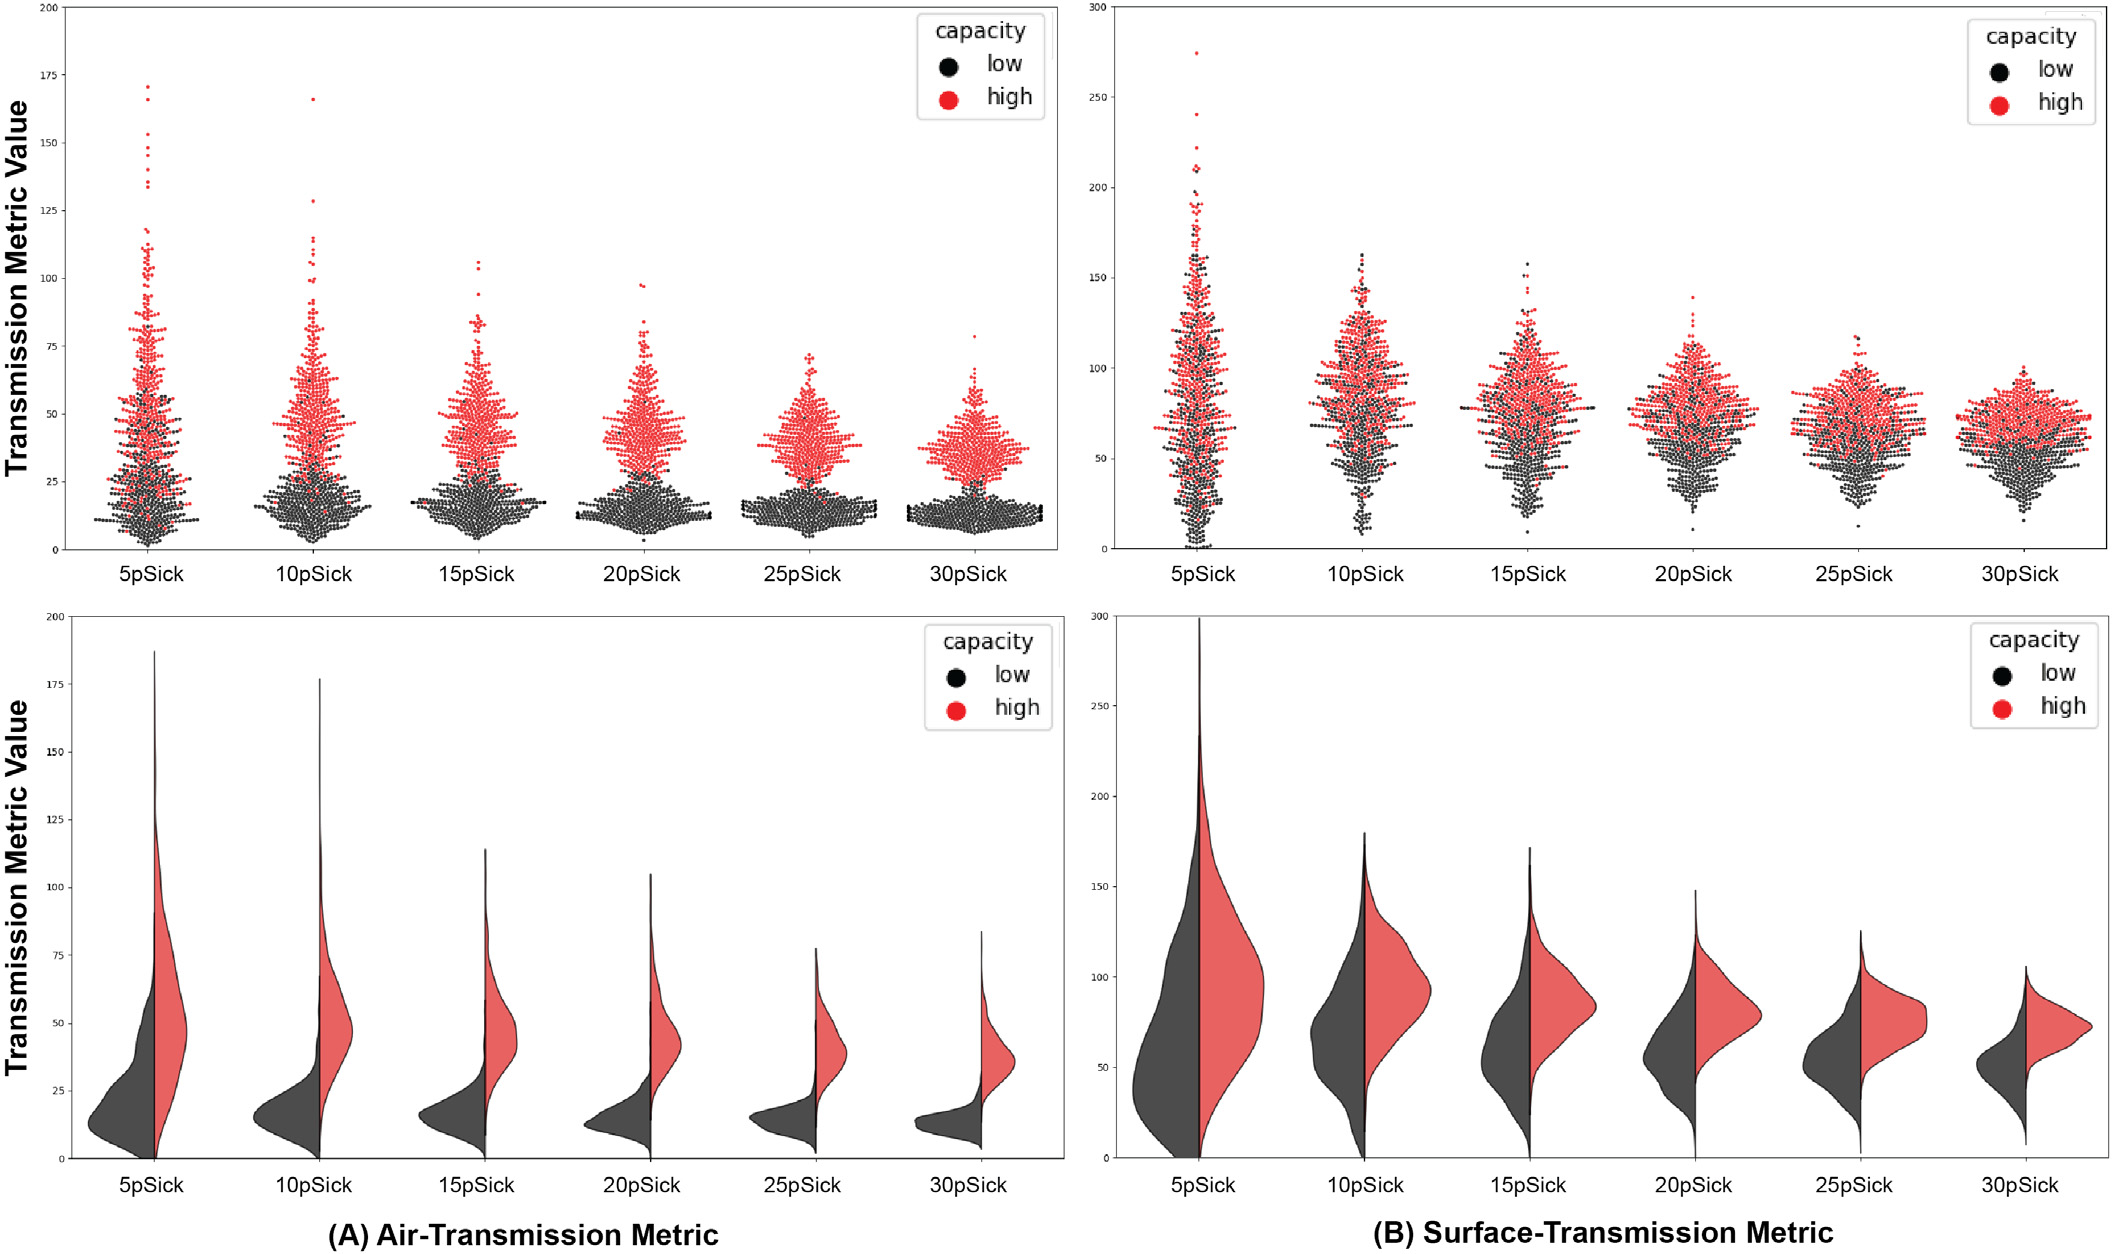
Simulation results from different percentages of contagious agents: 5%, 10%, 15%, 20%, 25%, 30%, using both a low (40 agents in total) and high capacity setting (100agents in total). Swarm plots (top) and violin plots (bottom) demonstrate the distribution of the results obtained from 400 simulation runs, for each combination of conditions. Fig. 5.
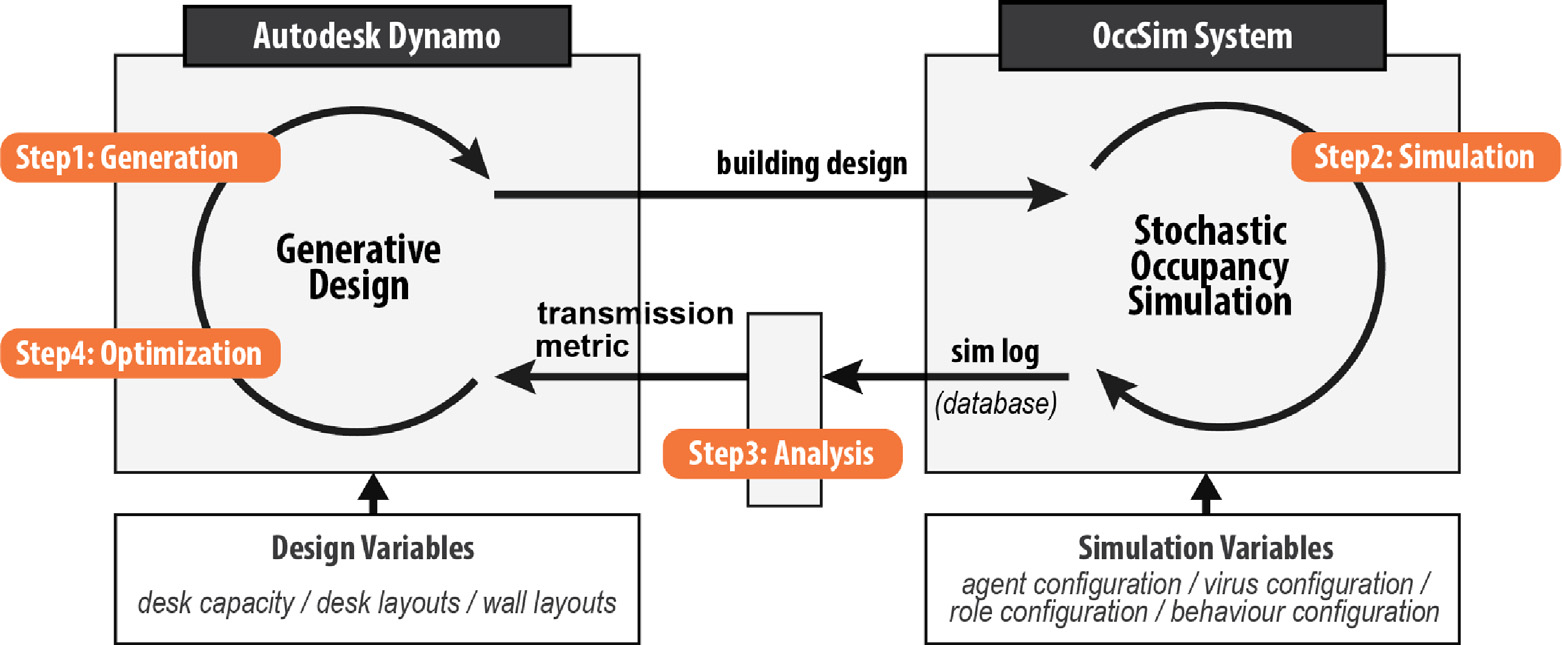
Scope and contribution of our work.
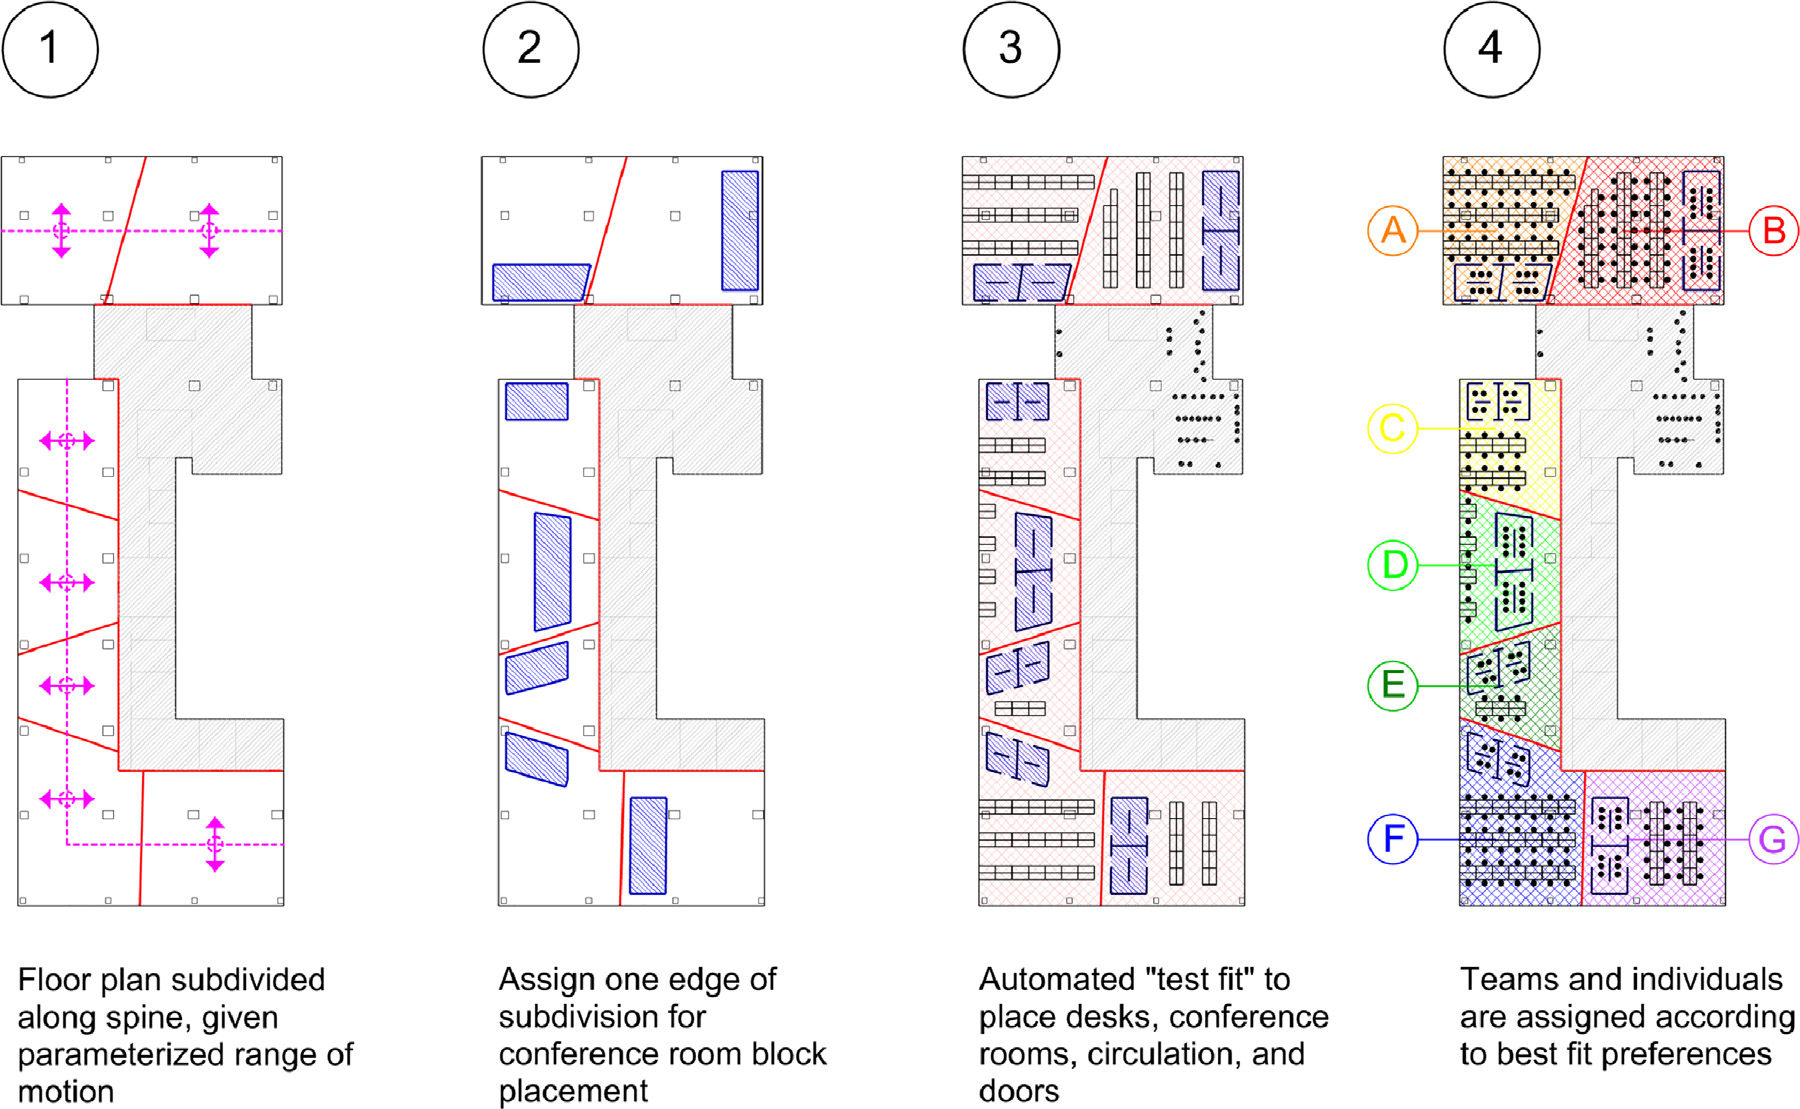
Generative geometry model for case study (Nagy, Lau et al., 2017).
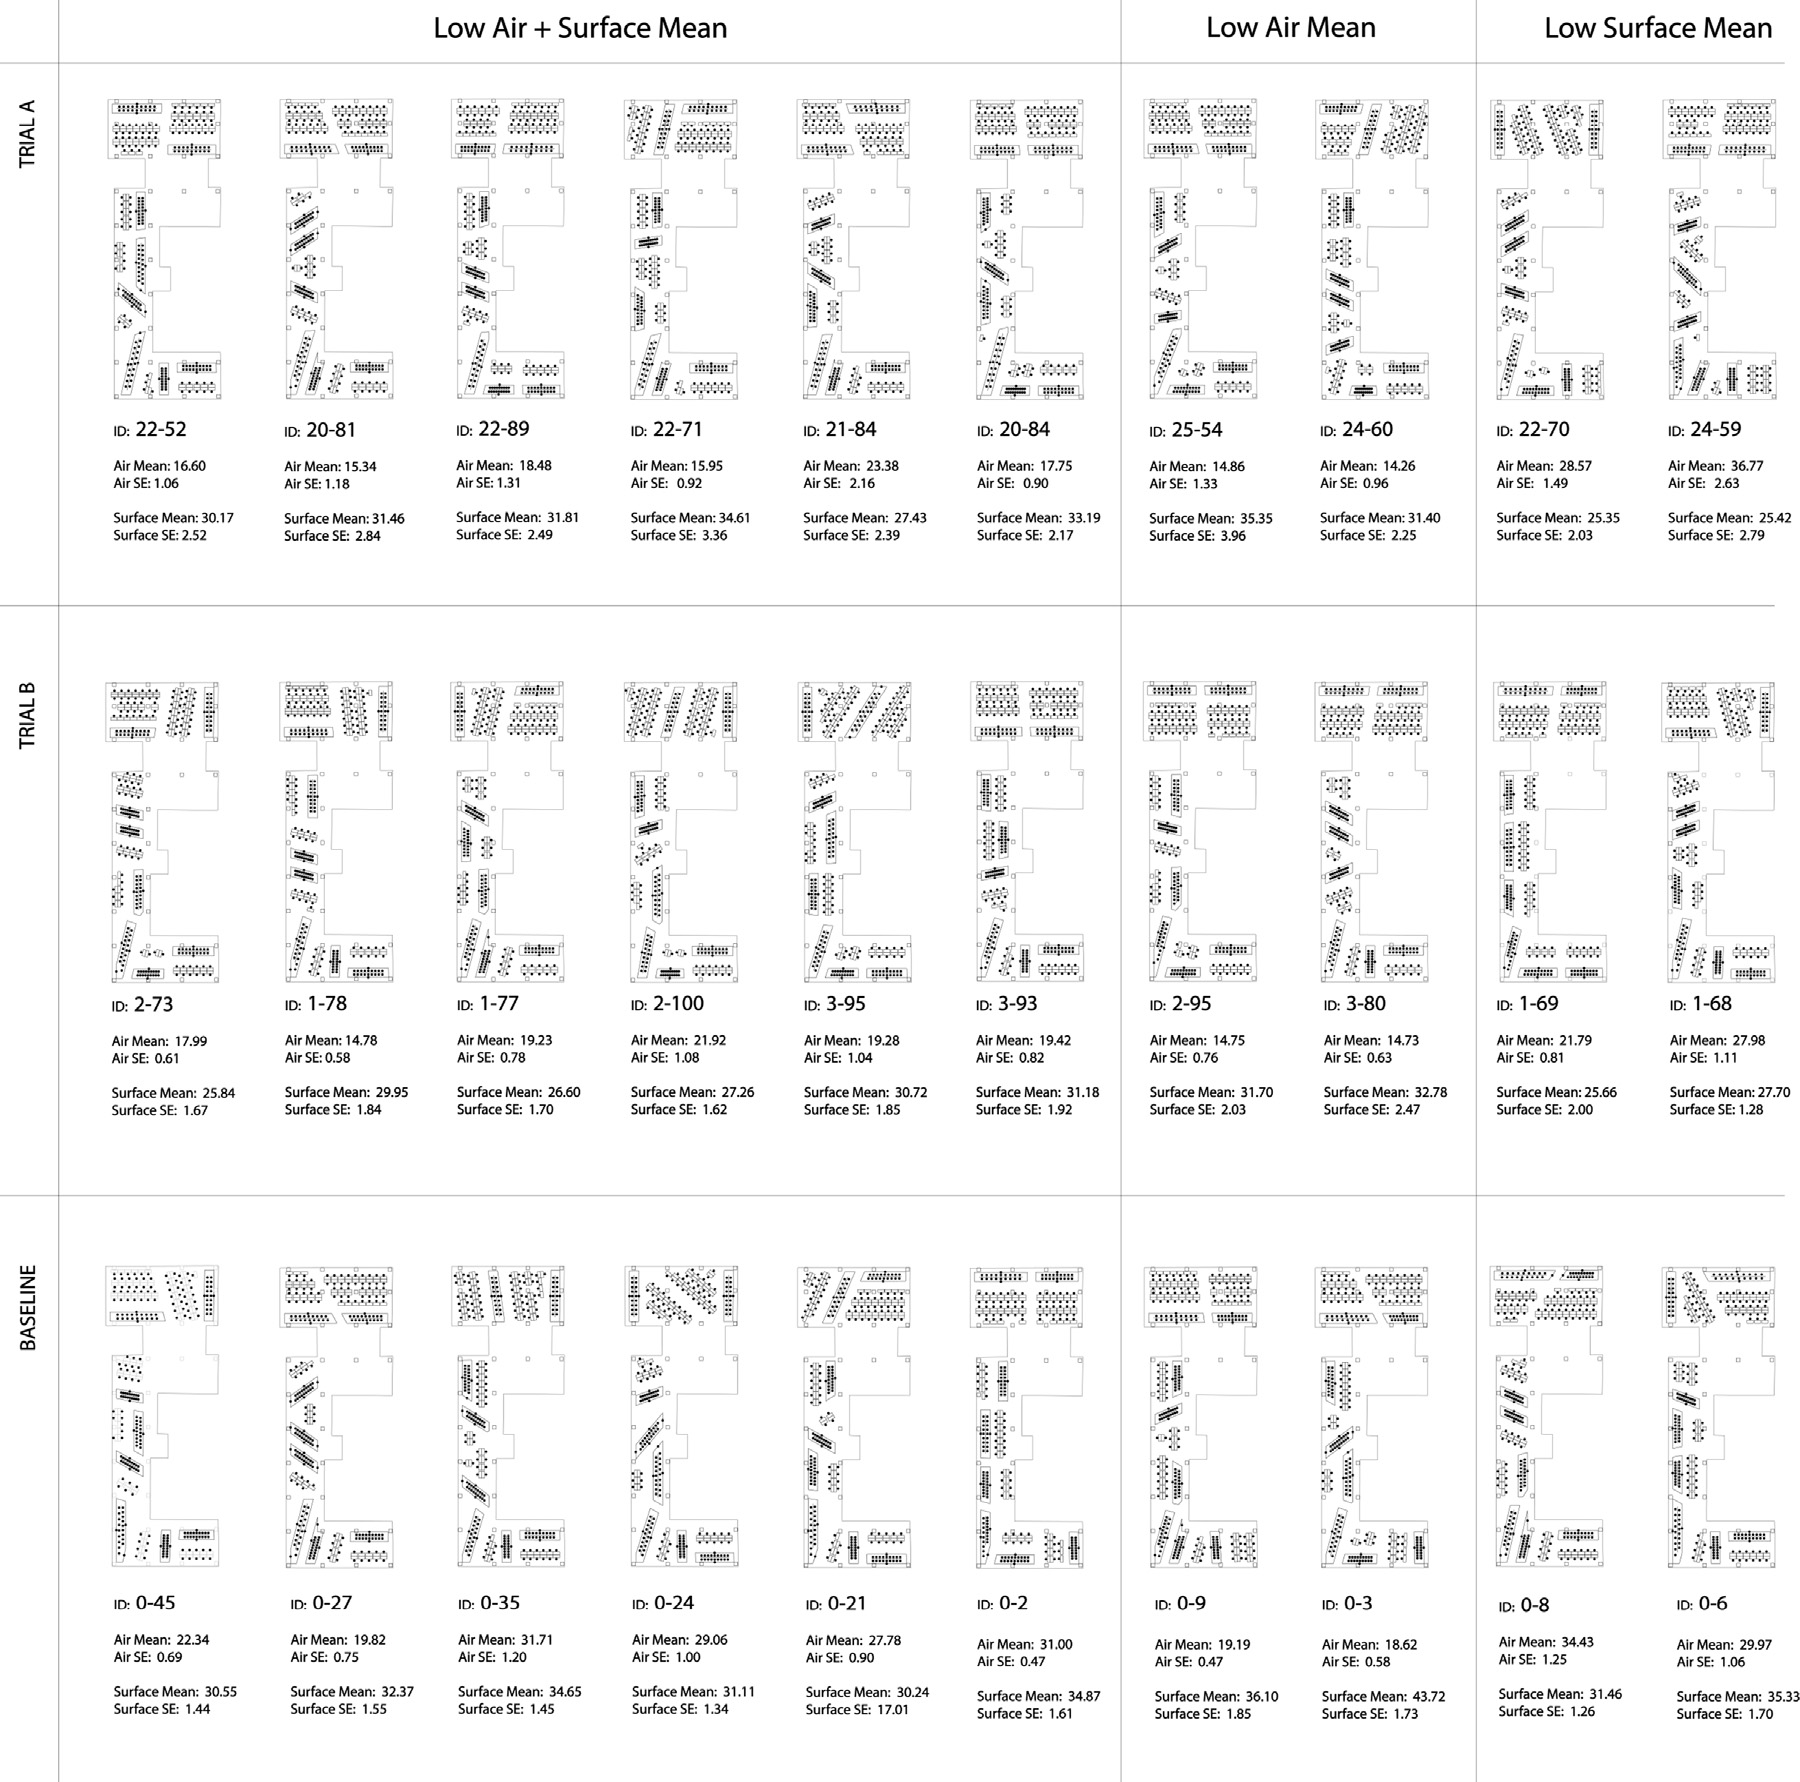
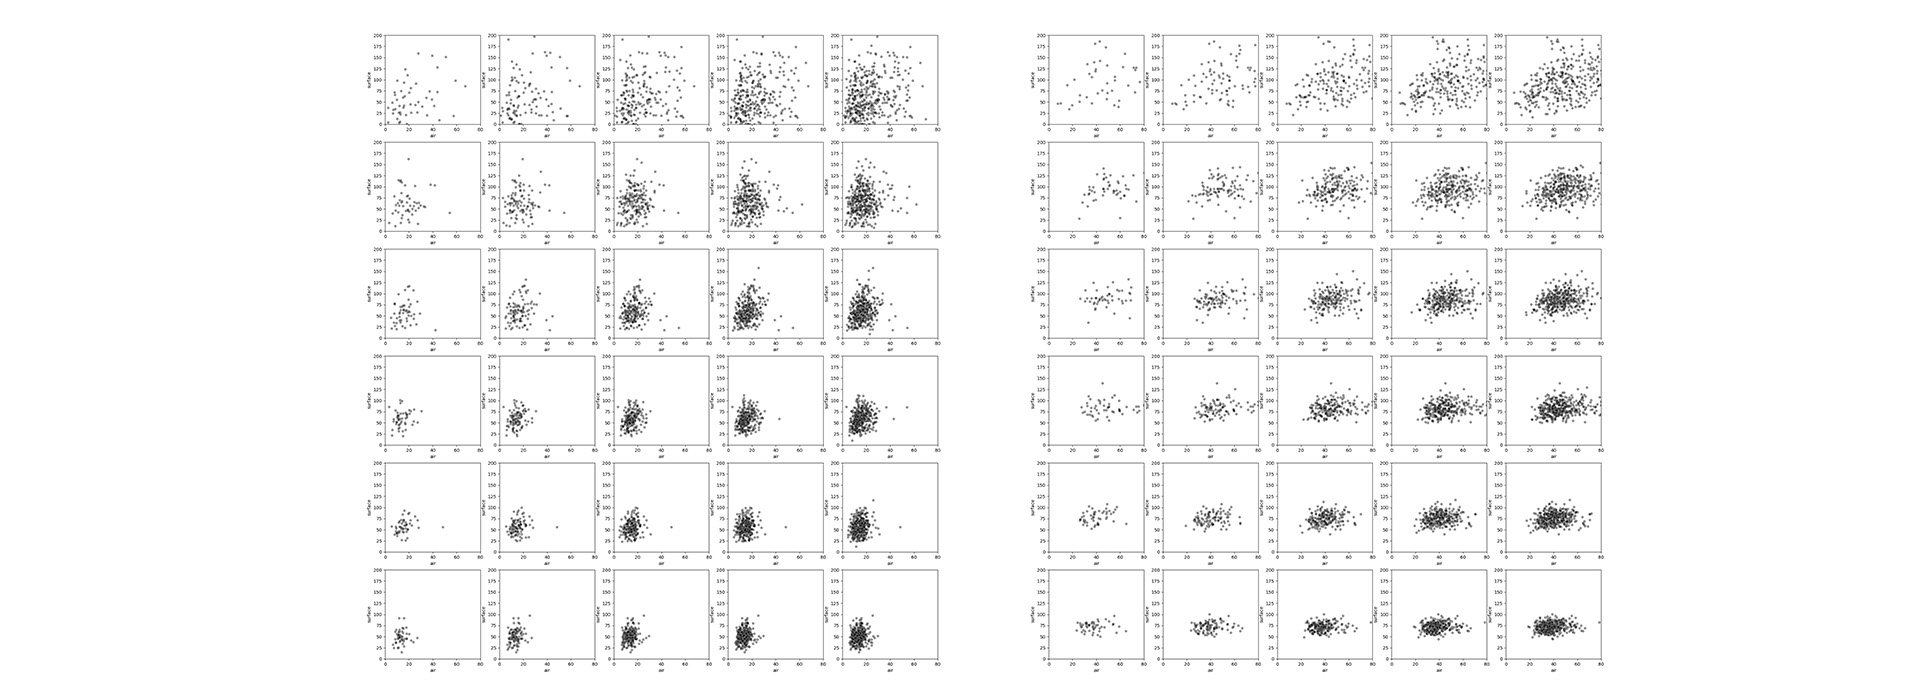
Top ten performing designs from each trial in terms of air+surface, air, and surface metrics.
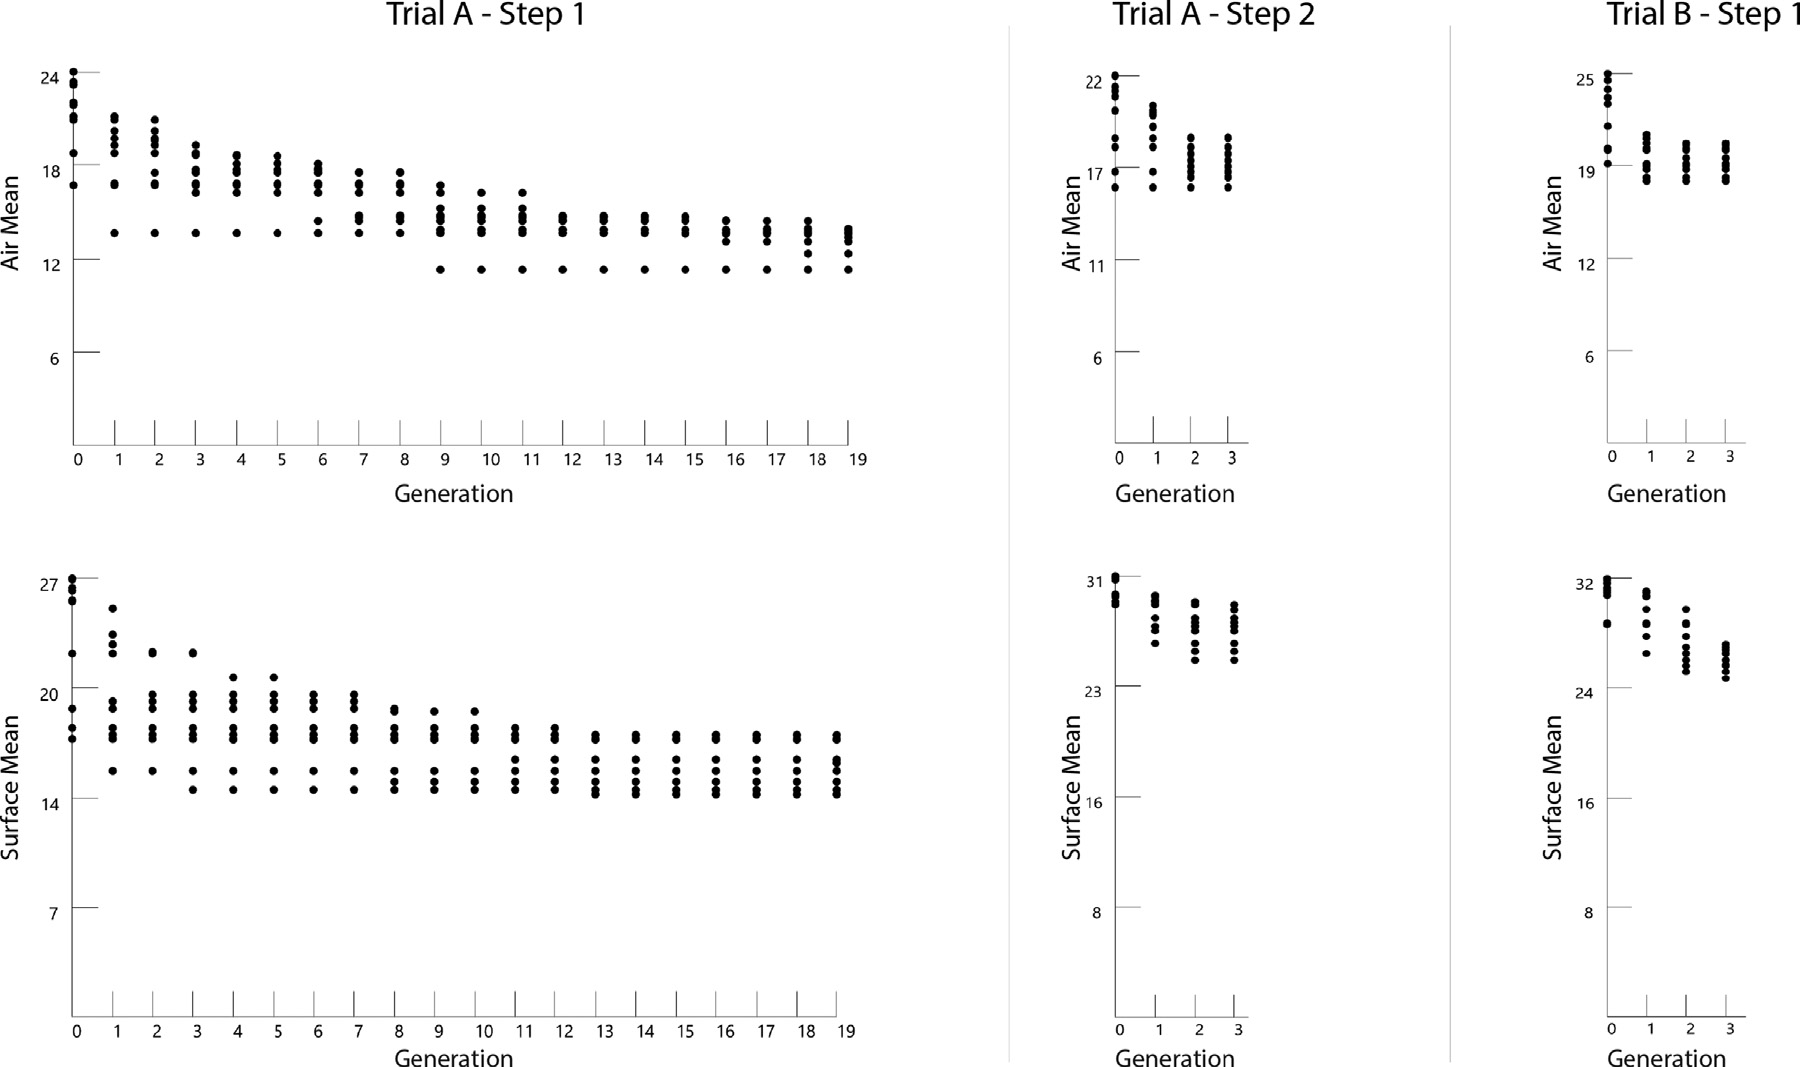
Air and surface transmission metrics over generation number, demonstrating NSGA-II optimization’s ability to minimize virus transmission over successive generations.
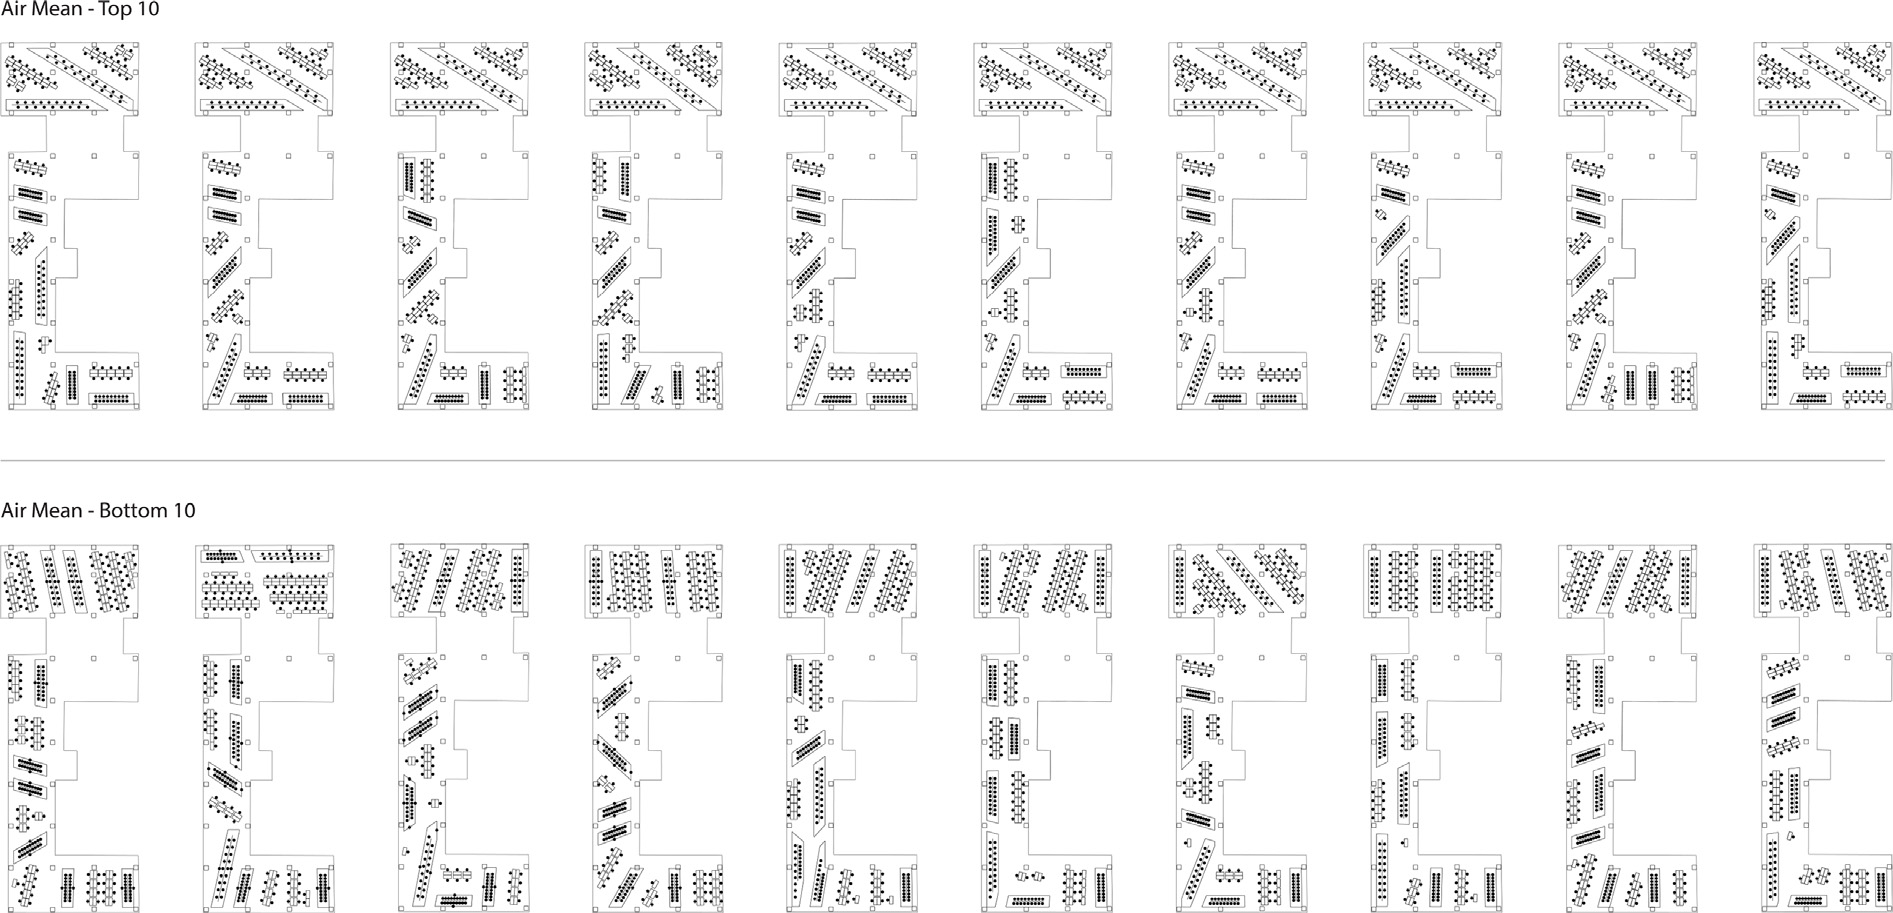
Top 10 highest and lowest performing designs for air mean from Trial A run.